Profiling of member/user activity
Profiling provides portal administrators with detailed technical information about the current sessions of portal members as well as back end users. This information includes details about activity of members and users that are currently signed in. Information collected in profiling can be used by admins for analysis purposes, for example to debug performance issues.
|
In addition to profiling, you can also configure member activity tracking, which allows tracking member activity on the portal (activity of users cannot be tracked). Data collected in member activity tracking can be viewed on a grid page; however, the member activity log doesn't provide technical details, only information about simple actions performed by members. |
To use profiling of member/user activity
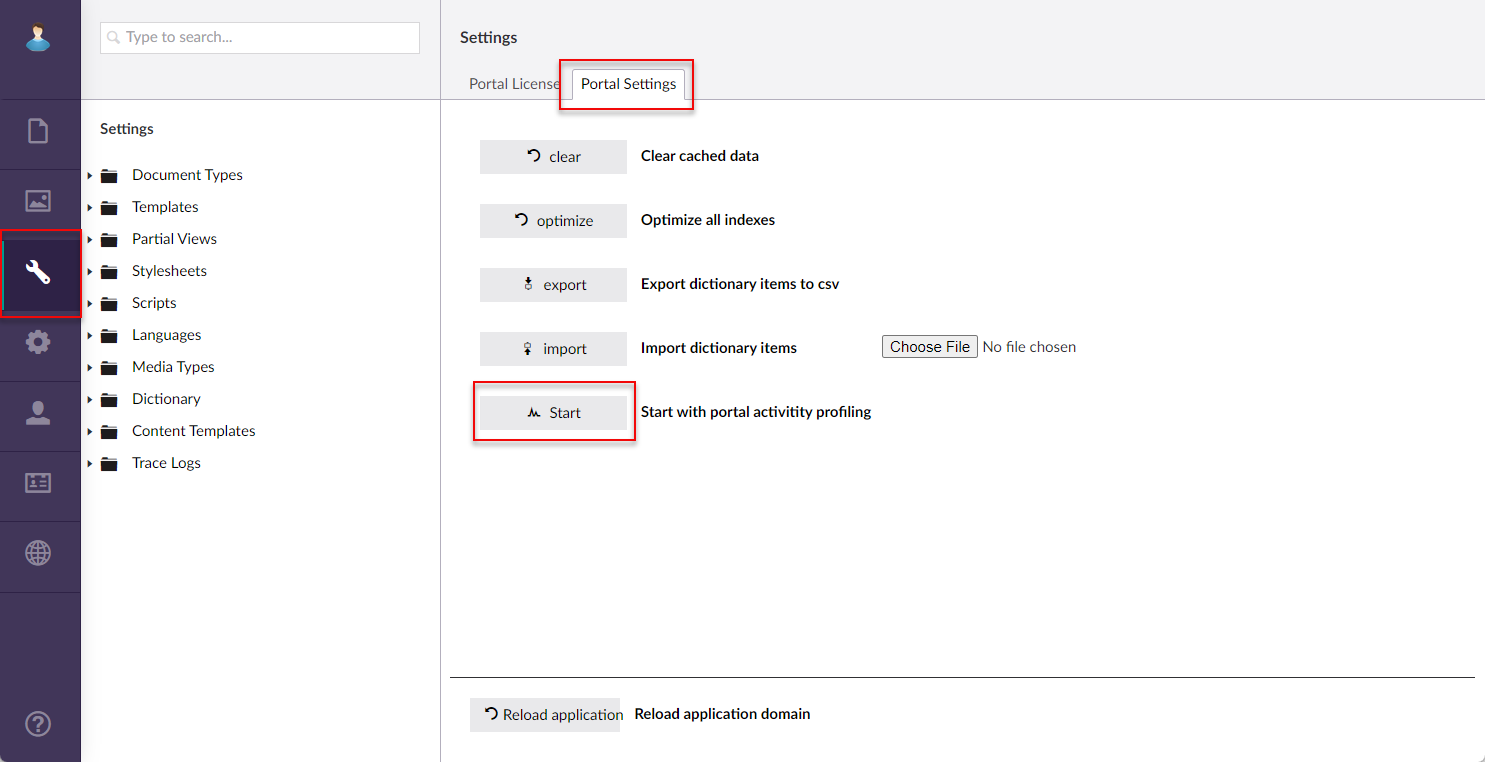
- In CMS, go to Settings.
- On the Profiling tab, enable Activate the profiler by default.
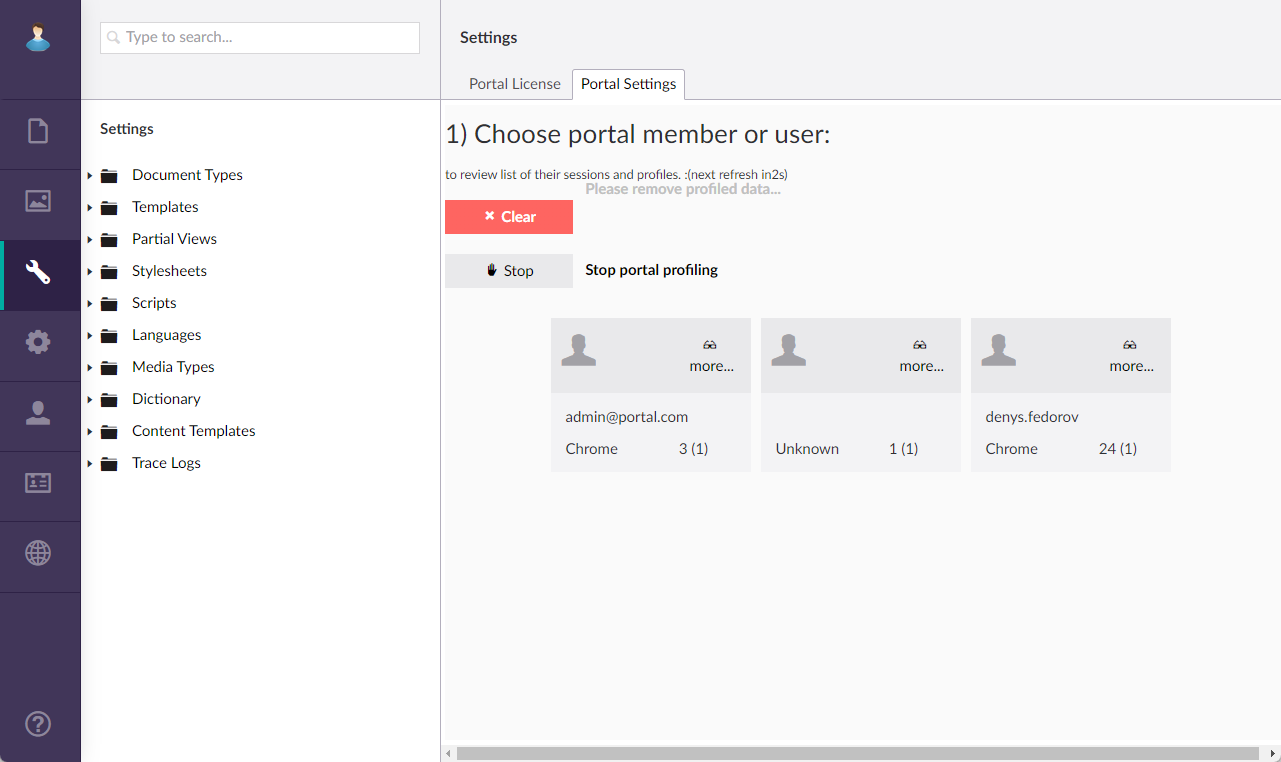
All users and members currently signed in are displayed. At the bottom of the user.member tile, you can see the title of the web browser they are using, the number of log entries and sessions (in brackets).
 Tip
TipIf there are no members or users shown while are sure that there should be some sessions, you may need to check that the profiling functionality is turned on in the web.config file for the portal: the XPortal.EnableProfiling setting value must be set to 1.
<add key="XPortal.EnableProfiling" value="1" />
By default, this functionality is enabled on a new portal installation and doesn't need to be enabled manually. However, if profiling doesn't work, you can check this setting for troubleshooting purposes.
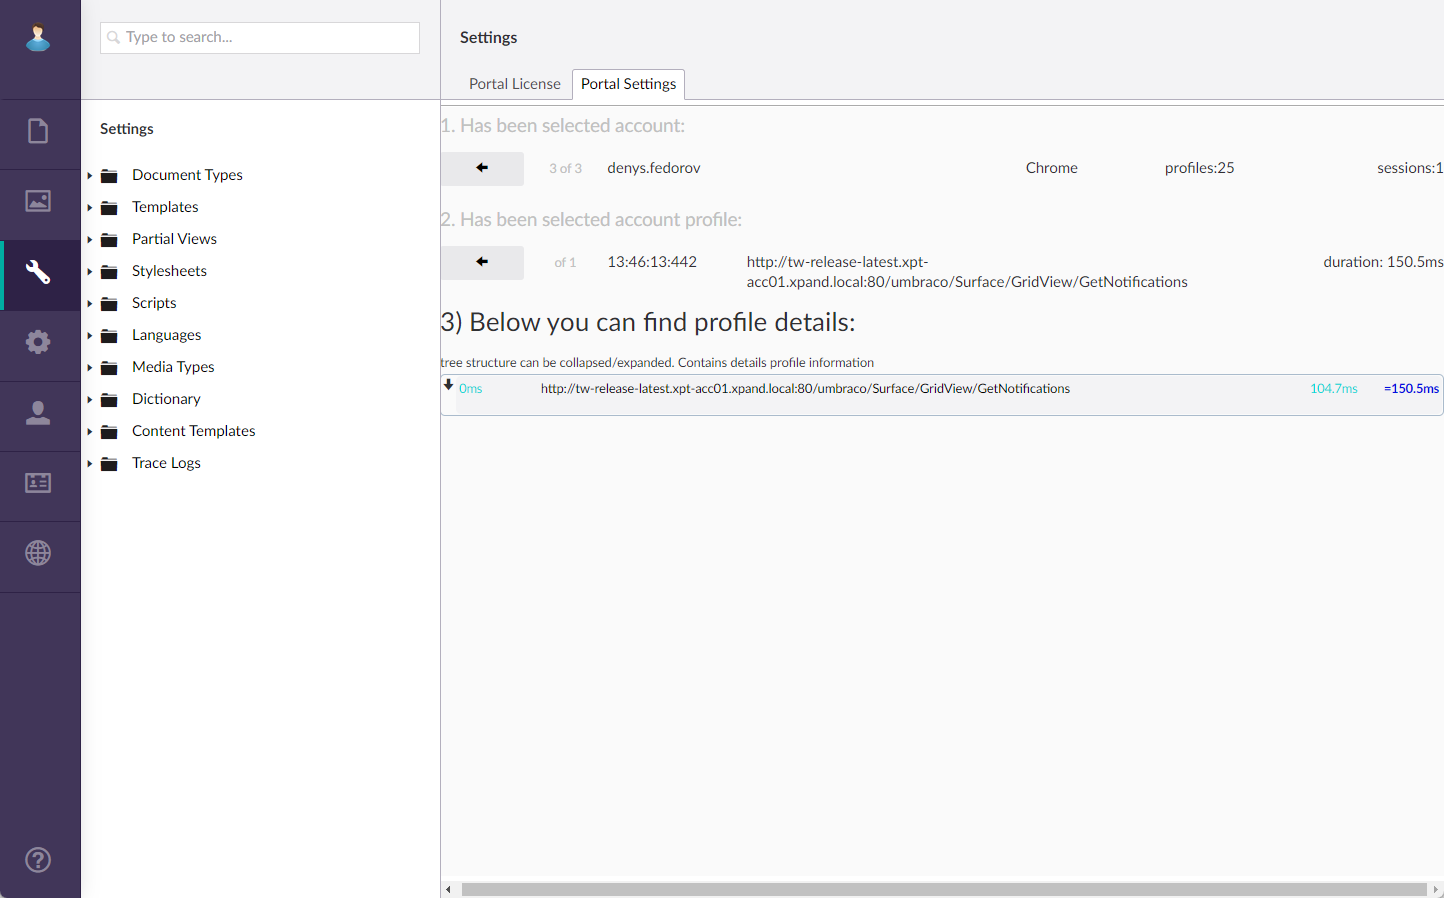
- Select the tile of user.member to see the detailed log of their session.
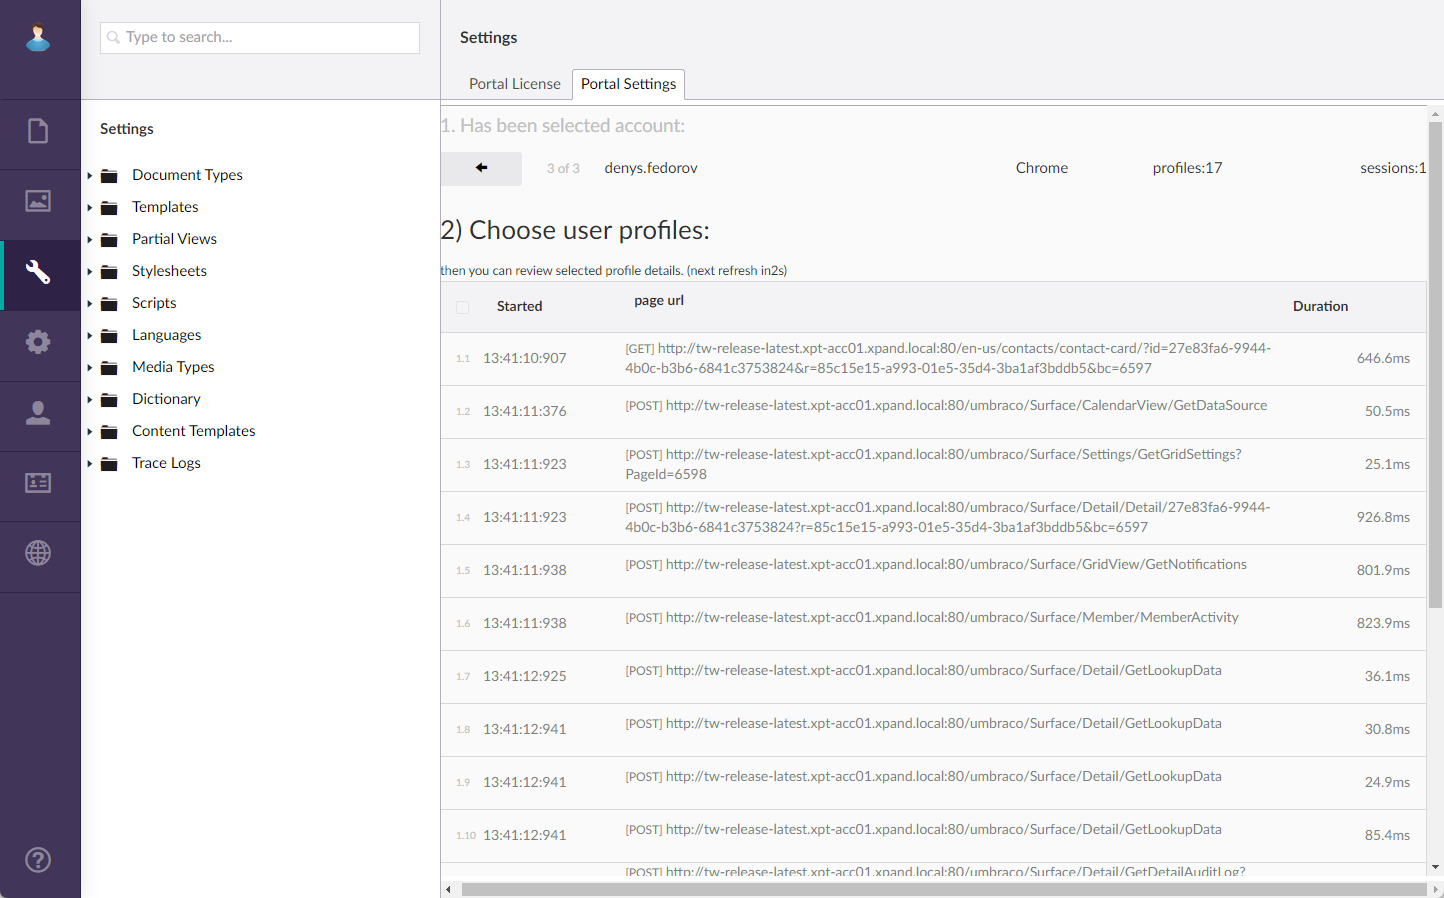
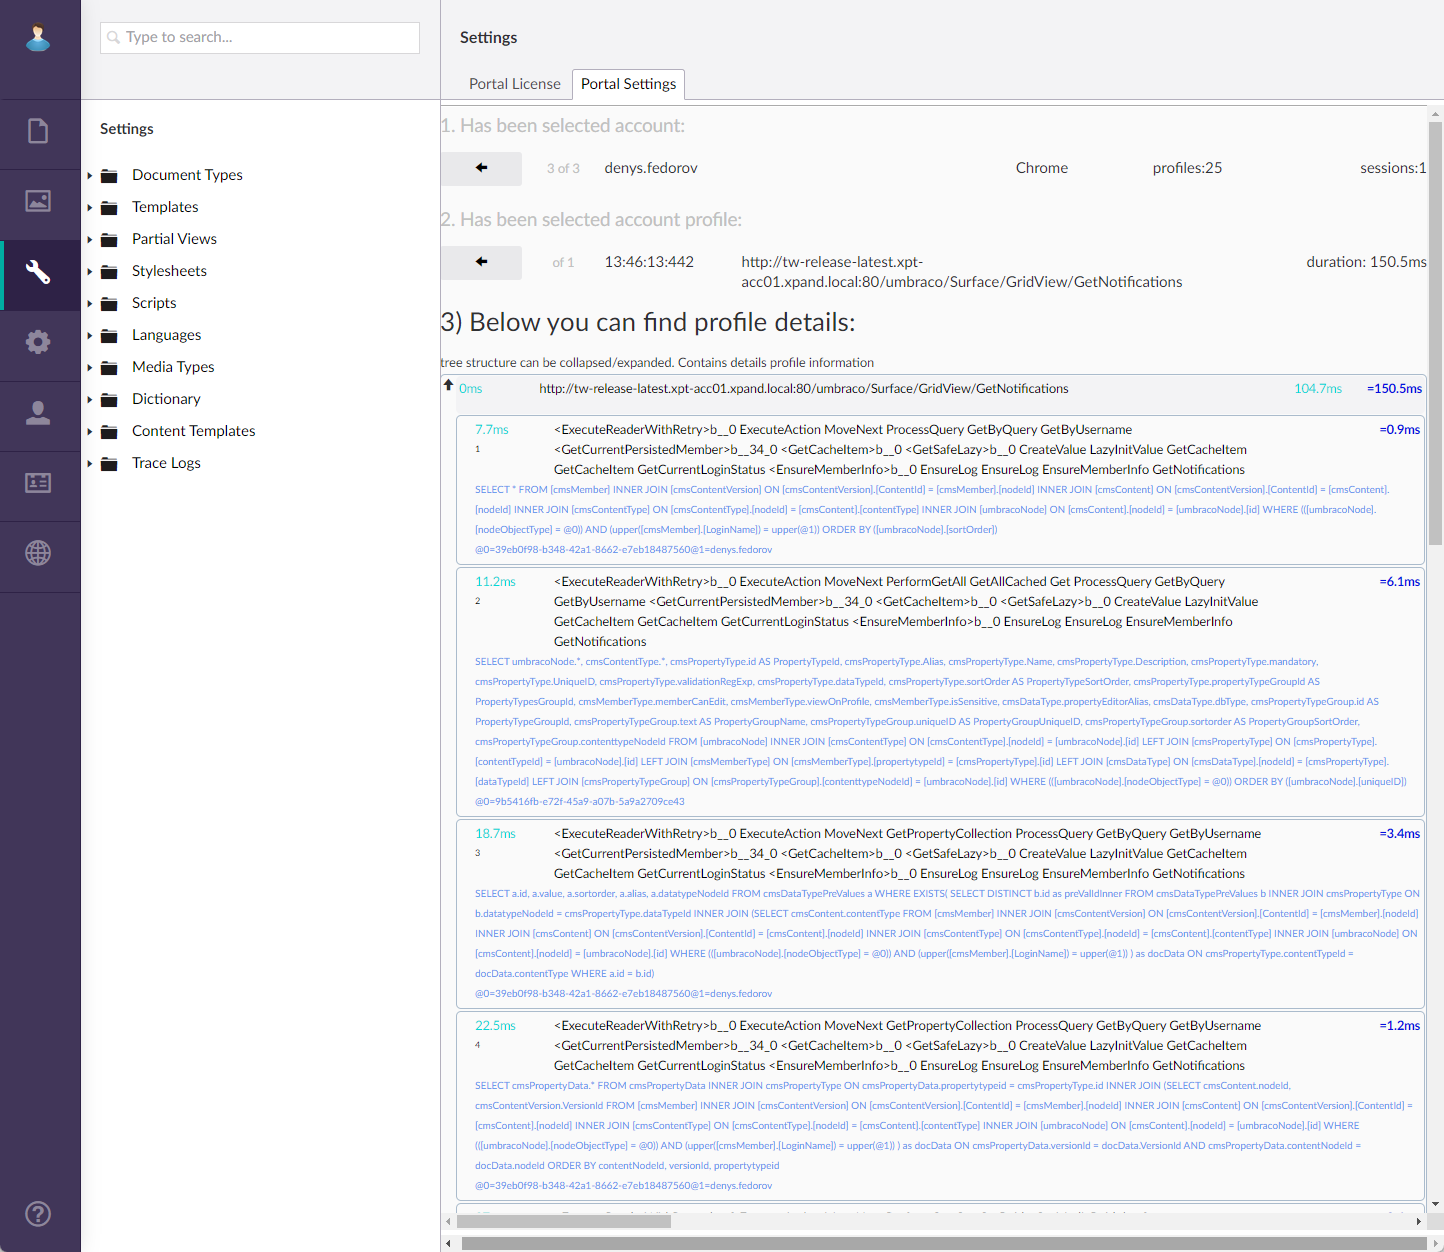
For every log entry, you can see the time when the activity was started, the page URL, and duration (time taken for the activity to take place). - Select a log entry to view detailed technical information about that log entry.
- Select the
 icon to expand the entry and see technical details.
- Select the
 icon to collapse the technical detailed.
 - Select the
 icon on any step to return to the previous page.
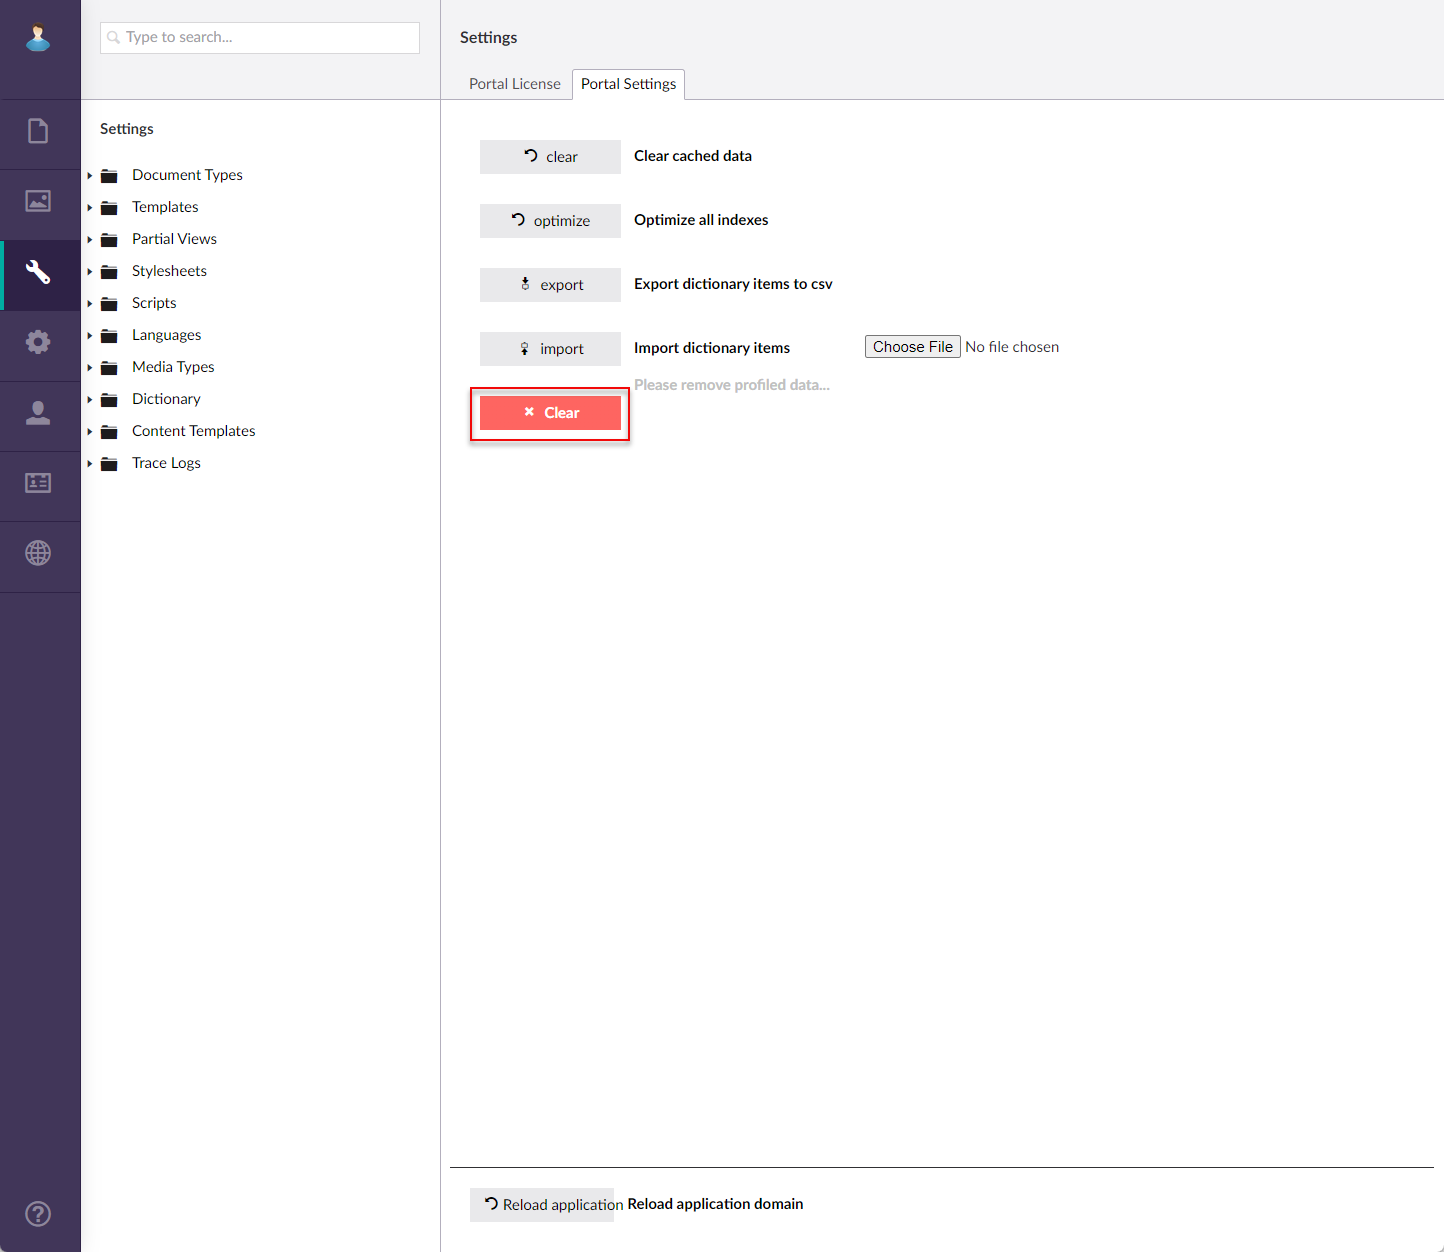
 - On the first step, you can select the Clear button to clear the currently logged profiling data.
- Once you are done with data analysis, select the Stop button to stop the profiling.
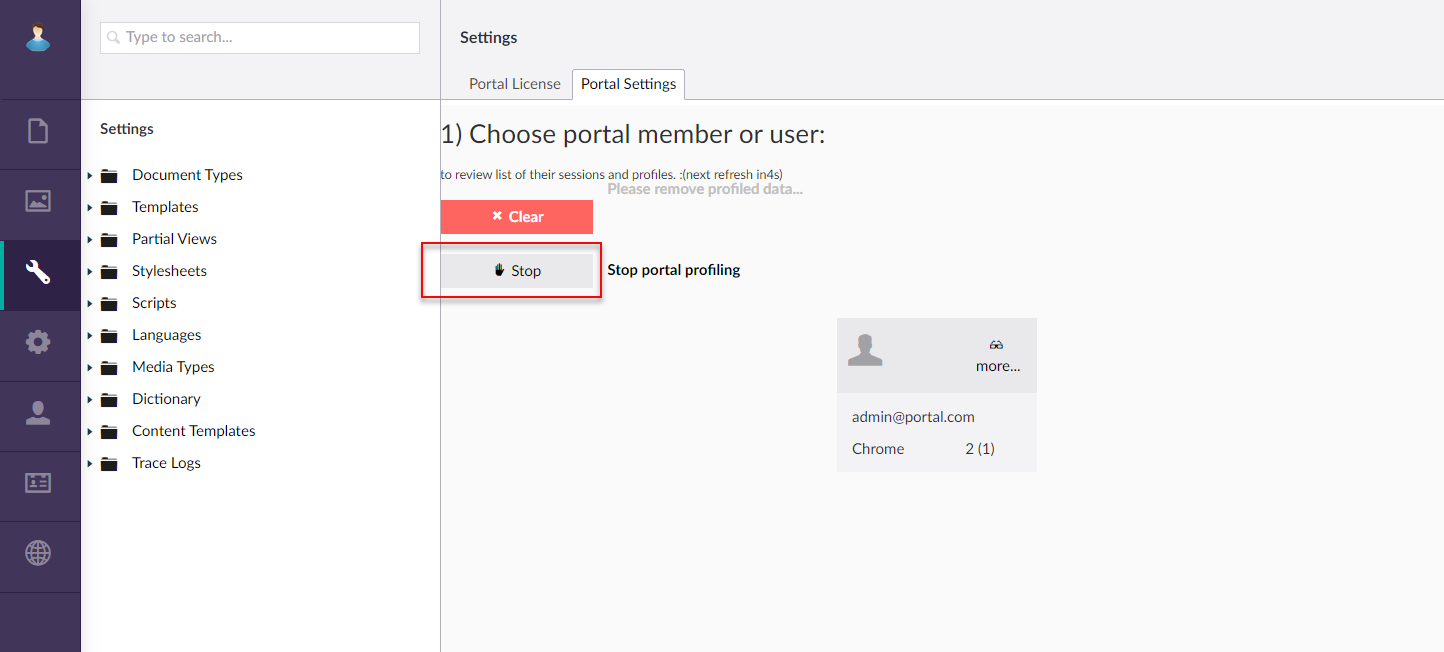
- Select Clear to remove profiling data.