Gauge tile (configuration)
A gauge tile is is an element of a ![]() grid,
grid, ![]() detail, or
detail, or ![]() dashboard layout block that is used to measure a certain amount and display it in the form of gauge.
dashboard layout block that is used to measure a certain amount and display it in the form of gauge.
To add a gauge tile to a page
- In the backoffice, go to Content and expand the node of a
 grid page,
  detail page, or
  dashboard (home) depending on where you want to add a gauge.
 - Select the
 icon next to the corresponding layout block node (
 grid,
grid,  detail, or
  home dashboard). Alternatively, select and hold (or right-click) the node, and then select Create.
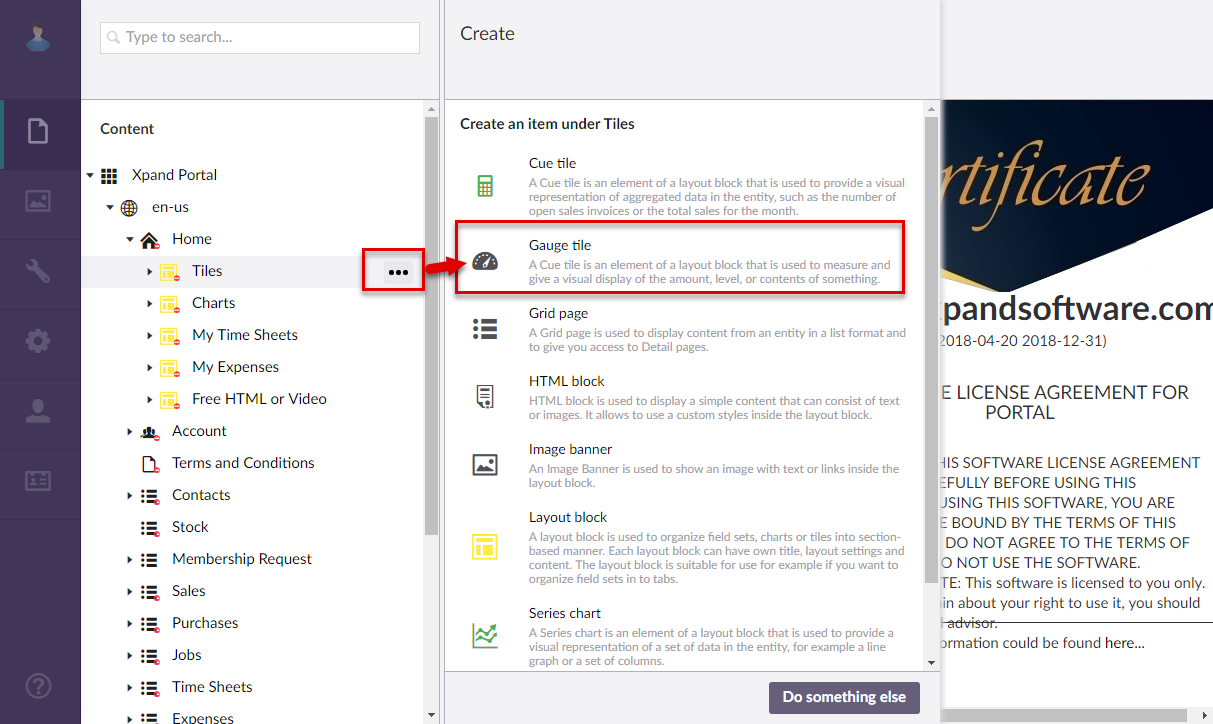
 - Select
 Gauge tile.
- On the header, enter the gauge tile name that will be used to identify it in the backoffice.
- On the General tab, fill in general settings as follows:
- Titles - Specifies the settings where you can configure the title of various elements on this page.
- Title - Specifies the title that will be displayed in the header of the created page or page element.
- Subtitle - Specifies the subtitle that will be displayed in the header of the created page or page element.
- Icon - Specifies the image that will be displayed in front of the title if specified. Adding an icon is optional. You can leave this setting empty (in this case, the default icon, chosen by the development team, will be used) or choose an icon from one of the available icon libraries.
- Responsive behavior - Specifies the settings that define how this page part or UI element responds to different viewport widths by adjusting its width and visibility at each responsive breakpoint.
- Hide element - Specifies that the element will be hidden for specific member groups. Select one or several member groups, for which this layout block element will be hidden. Alternatively, you can select the ~All~ checkbox to hide it for all member groups (without the necessity to select every member group's checkbox) or select the Hide element checkbox to have all member groups selected at once.
- Description - Specifies a description of this layout block element.
- Content-from page - Specifies the page the content of which will be displayed instead of the content of this page when this page is opened via a direct link. The URL in the address bar will remain that of the original page. For a page element, filling in this setting is not required.
- Redirect-to page - Specifies the page that will be displayed instead of this page when this page is opened via a direct link. The URL in the address bar will be that of the target page. For a page element, filling in this setting is not required.
- Module assignment & protection - Specifies settings that allow you to assign this content element (localization, page, etc.) to an internal module as well as to protect this element from certain operations (copying, changing, deletion). Select the Configure button to configure module assignment & protection or the Change button to edit existing configuration if it has already been configured.
- Titles - Specifies the settings where you can configure the title of various elements on this page.
- On the Data source tab, specify the portal entity that will be used as data source for this gauge tile as well as configure filters if necessary.
- Entity - Specifies the portal entity data from which will be retrieved for this gauge tile. The list of available entities depends on the system your portal is integrated with.
- Filters - Specifies the filter(s) which can be used to narrow down the records that will be used from the specified entity by specified criteria. You can add filters individually, in groups, or in combination of individual filters and groups. Grouped clauses operate as a single unit separate from the rest of the query, similar to putting parentheses around a mathematical equation or logic expression. The AND or OR operator specified for the filter group applies to the whole group. Setting filters is optional and depends on what kind of data you want to be displayed on the page.
- To add an individual filter, select Add content, select
 Filters, and the configure filter settings:
- Title - Specifies the title of the filter.
- Logic – Specifies the logic of the filter:
- AND – Use this type to find records in the data source that meet the criteria in both the current and previous clause.
- OR – Use this type to find records in the data source that meet the criteria in either the current or previous clause.
- Field – Specifies the field from the source entity the value of which will be used to filter records on the page.
- Operator – Specifies a symbol that denotes a logical operation.
- Value – Specifies the value of the field that will be used to filter records on the page. You can specify constant value or use a method to retrieve data. Select Add content and configure the type of value and its settings:
- Constant value – Specifies a constant value that will be used as a filter condition during lookup. If the value of the specified field is equal (or more, or less, etc., depending on the operator) to this value, the filter condition will be met.
- Date-time value – Specifies a date-time value that will be used as a filter to retrieve data.
- Value-from member field name – Specifies a field from the portal member settings, the value from which will be used as a filter.
- Value from parent entity field – Specifies a field from a parent entity on the portal, the value from which will be used as a filter during lookup.
- Value from entity - Specifies the entity and field from this entity the value from which will be used as the filtering condition for records in the entity table.
- Address field – Specifies the name of a query string parameter (the part of a uniform resource locator (URL) that assigns values to specified parameters), which will be used as a condition for the field value in this filter.
- Field – Specifies a field from the current entity (an entity, to which the field that you are configuring lookup settings for belongs) the value from which will be used as a filter during lookup. This may be useful if you want to see value for the lookup entity that are related to the current entity.
- Disable current filter – Use this switch to temporarily disable the filter for this page.
- To add a filter group, select Add content, select
 Filters group, configure the filter group settings below, and then select Create:
- Title - Specifies the title of the filter.
- Logic– Specifies the logic of the filter group:
- AND – Use this type to find records in the data source that meet the criteria in both the current and previous clause.
- OR – Use this type to find records in the data source that meet the criteria in either the current or previous clause.
- Filters in group – Specifies filters that will belong to this filter group. The Logic setting above will be applied to the whole group of filters. Select Add content to add a new filter to the group, and configure its settings in a similar way you configure settings for individual filters.
- Disable current filter - Specifies whether the current filter is disabled on this page.
- Disable empty filter - Use this switch to disable filters that are empty and cannot be applied.
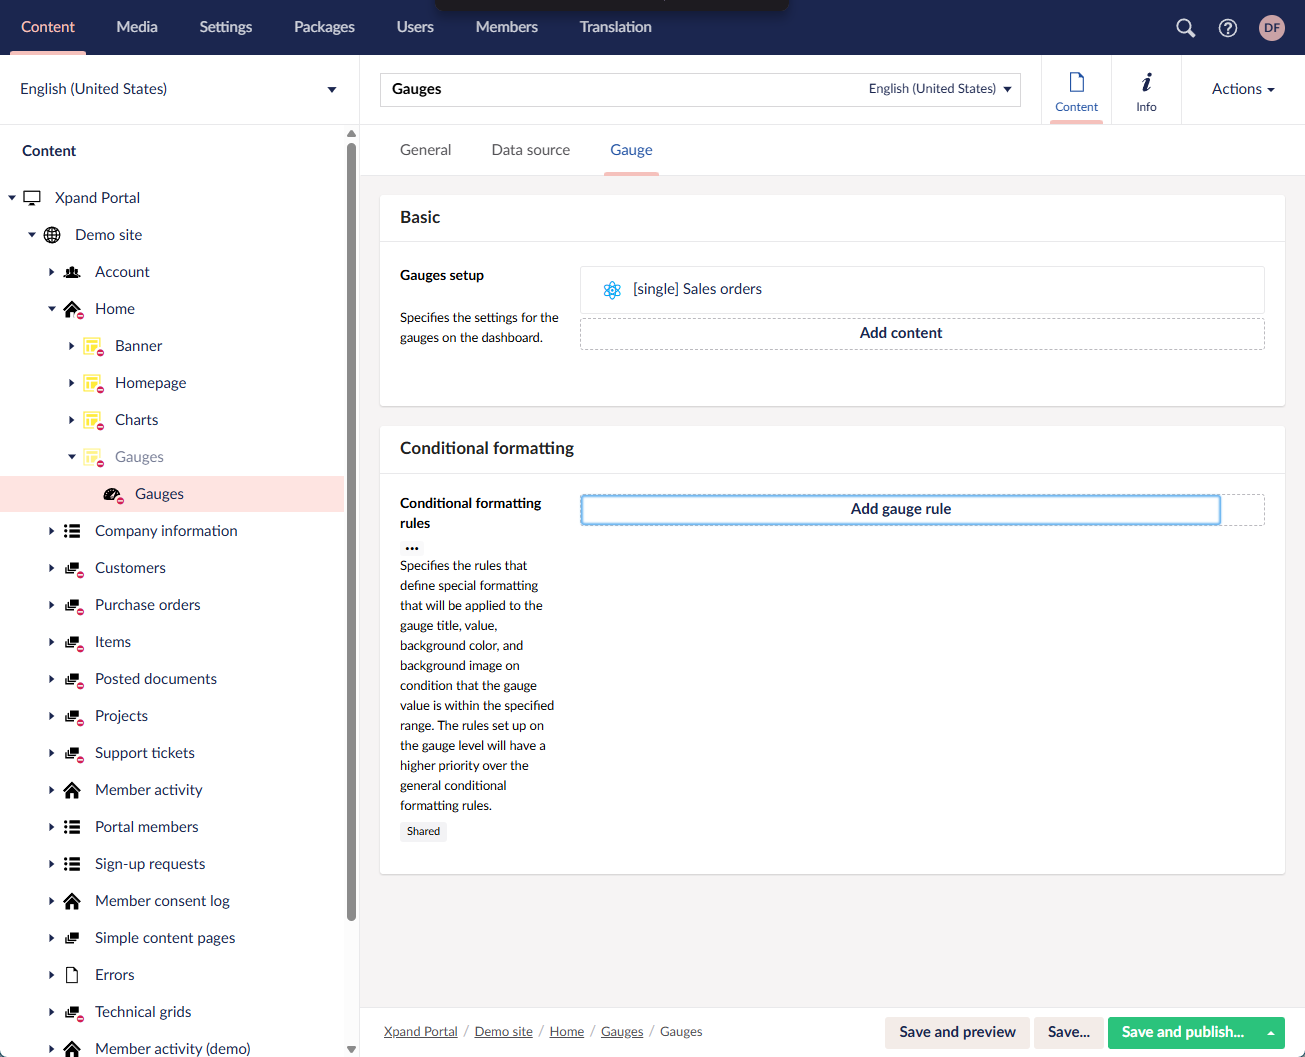
- On the Gauge tab, add gauges that will display data. You can create several gauges to break down data into logical parts.
- Gauges setup - Select Add content to add a tile with a gauge, and specify its settings. There are two types of gauges that you can add: static or dynamic gauge. (1) A static gauge displays record statistics filtered by a specific field value; for every field value, you have to manually set up a gauge. (2) A dynamic gauge displays record statistics for all or specifically chosen multiple values of a selected field from the data source; for every unique value, gauges will be generated automatically.
- Static gauge:
- Filters - Specifies a filter by a field value. Select the icon again to add more filters if necessary. Setting filters is optional and depends on what kind of data you want to be displayed on the new grid page.
- Base entity filter - Specifies an additional filter for the base entity, the retrieved data from which will be used as a 100% value in gauge calculations.
- Title - Specifies the title of the gauge that will be displayed on the front end.
- Image - specifies the image that will be displayed in the corner of the tile with the gauge.
- Background:
- Background image - Specifies the image that will be used as background for the gauge tile.
- Background color - Specifies the color that will be used as solid filled background for the gauge tile.
- Description - Specifies the text or images that will be displayed on this page.
- Responsive behavior - Specifies the settings that define how this page part or UI element responds to different viewport widths by adjusting its width and visibility at each responsive breakpoint.
- Conditional formatting rules - Specifies rules that define formatting that will be applied to the title, value, background (color and image) on condition that the gauge value is within the range specified in the condition. This is the same setting as conditional formatting rules for all gauges, but specific to this gauge. If you set up conditional formatting rules both on the gauge page (for all gauges) and on the gauge levels, the conditional formatting rules on the gauge page level (for all gauges) will have a higher priority.
- Header font color - Specifies the font color that will be applied to the gauge header text.
- Counter color - Specifies the font color that will be applied to the gauge counter text.
- Template - Specifies settings for the template that the gauge field is based on.
- Template - Template - Specifies a predefined template that will be used to display this gauge tile. This setting is not mandatory. Select a template if available.
- Value template - Specifies whether a custom field value format will be enabled, for example: currency $value template:
$#= value.toLocaleString() #
- Aggregations - Specifies that calculation of average, maximum, minimum, or sum of the chosen field values is enabled.
 Sum value - A sum of all values of a field will be calculated and displayed in the tile. Select a field the values of which will be summed up on all records.
 Average value - The average of all values of a field will be calculated and displayed in the tile. Select a field the average values of which will be calculated on all records.
 Max. value - The highest value of all values of a field will displayed in the tile. Select a field the highest value of which from all records will be shown.
 Min. value - The lowest value of all values of a field will displayed in the tile. Select a field the lowest value of which from all records will be shown.
 Caution
Aggregation methods other than the default one (counting of records) may impact performance.
- Dynamic gauge:
- Field - Specifies the field the values from which will be used to automatically created gauges. For every unique value, a new gauge will be automatically added. You can set a filter by specific field values. This setting is available only for dynamic gauges.
- Filters - Specifies a filter by a field value. Select the icon again to add more filters if necessary. Setting filters is optional and depends on what kind of data you want to be displayed on the new grid page.
- Base entity filter - Specifies an additional filter for the base entity, the retrieved data from which will be used as a 100% value in gauge calculations.
- Title - Specifies the title of the gauge that will be displayed on the front end.
- Image - specifies the image that will be displayed in the corner of the tile with the gauge.
- Background:
- Background image - Specifies the image that will be used as background for the gauge tile.
- Background color - Specifies the color that will be used as solid filled background for the gauge tile.
- Description (body content) - Specifies the text or images that will be displayed on this page.
- Responsive behavior - Specifies the settings that define how this page part or UI element responds to different viewport widths by adjusting its width and visibility at each responsive breakpoint.
- Conditional formatting rules - Specifies rules that define formatting that will be applied to the title, value, background (color and image) on condition that the gauge value is within the range specified in the condition. This is the same setting as conditional formatting rules for all gauges, but specific to this gauge. If you set up conditional formatting rules both on the gauge page (for all gauges) and on the gauge levels, the conditional formatting rules on the gauge page level (for all gauges) will have a higher priority.
- Header font color - Specifies the font color that will be applied to the gauge header text.
- Counter color - Specifies the font color that will be applied to the gauge counter text.
- Template - Specifies settings for the template that the gauge field is based on.
- Template - Template - Specifies a predefined template that will be used to display this gauge tile. This setting is not mandatory. Select a template if available.
- Value template - Specifies whether a custom field value format will be enabled, for example: currency $value template:
$#= value.toLocaleString() #
- Sorting - Specifies how dynamic tiles will be sorted. Sorting by amount is based on the total number of records shown on every gauge. Sorting by value is based on the alphabetical or numeric order of the value of the field that is used for creating gauges.
- Max. number of gauges - Specifies the maximum number of gauges that can be created automatically. This is useful if the field that is used for creating gauges may have many unique values, and you don't want your dashboard to be overcluttered with gauges. By default, the limit is 20 gauges.
- Aggregations - Specifies that calculation of average, maximum, minimum, or sum of the chosen field values is enabled.
- Sum value - A sum of all values of a field will be calculated and displayed in the tile. Select a field the values of which will be summed up on all records.
- Average value - The average of all values of a field will be calculated and displayed in the tile. Select a field the average values of which will be calculated on all records.
- Max. value - The highest value of all values of a field will displayed in the tile. Select a field the highest value of which from all records will be shown.
- Min. value - The lowest value of all values of a field will displayed in the tile. Select a field the lowest value of which from all records will be shown.
Caution
Aggregation methods other than the default one (counting of records) may impact performance.
- Static gauge:
- Conditional formatting - Specifies rules that define formatting that will be applied to the gauge title, value, background (color and image) on condition that the gauge value is within the range specified in the condition. You can set up conditional formatting rules for all gauges or separately per gauge. Conditional formatting for all gauges will have a higher priority over the rules set up for a specific gauge. Using conditional formatting is optional.
- Condition range - Specifies the range of values that serves as a condition for applying the formatting set up for this condition rule. If a gauge value is within the condition range, the rule formatting is applied to the gauge.
- Lower bound value - Specifies the lowest allowed value for the condition to be met. If the field is empty, there is no lower bound limit (all values below the upper bound value meet the condition).
- Upper bound value - Specifies the highest allowed value for the condition to be met. If the field is empty, there is no upper bound limit (all values above the lower bound value meet the condition).
- Title template - Specifies the formatting template that will be applied to the gauge title if the condition rule is met. You can use the variable #=title#: for the title. If not specified, the dynamic filter title will be displayed.
- Value template - Specifies the formatting that will be applied to the gauge value if the gauge value is within the condition range. You can use the variable #=value#: for the title. If not specified, the dynamic filter value will be displayed.
- Body content - Specifies the text or images that will be displayed on this page.
- Font color - Specifies the font color that will be applied to the gauge text if the gauge value is within the condition range.
- Background image - Specifies the tile background image that will be used if the gauge value is within the condition range.
- Background color - Specifies the gauge background color that will be applied if the gauge value is within the condition range.
- Condition range - Specifies the range of values that serves as a condition for applying the formatting set up for this condition rule. If a gauge value is within the condition range, the rule formatting is applied to the gauge.
- Gauges setup - Select Add content to add a tile with a gauge, and specify its settings. There are two types of gauges that you can add: static or dynamic gauge. (1) A static gauge displays record statistics filtered by a specific field value; for every field value, you have to manually set up a gauge. (2) A dynamic gauge displays record statistics for all or specifically chosen multiple values of a selected field from the data source; for every unique value, gauges will be generated automatically.
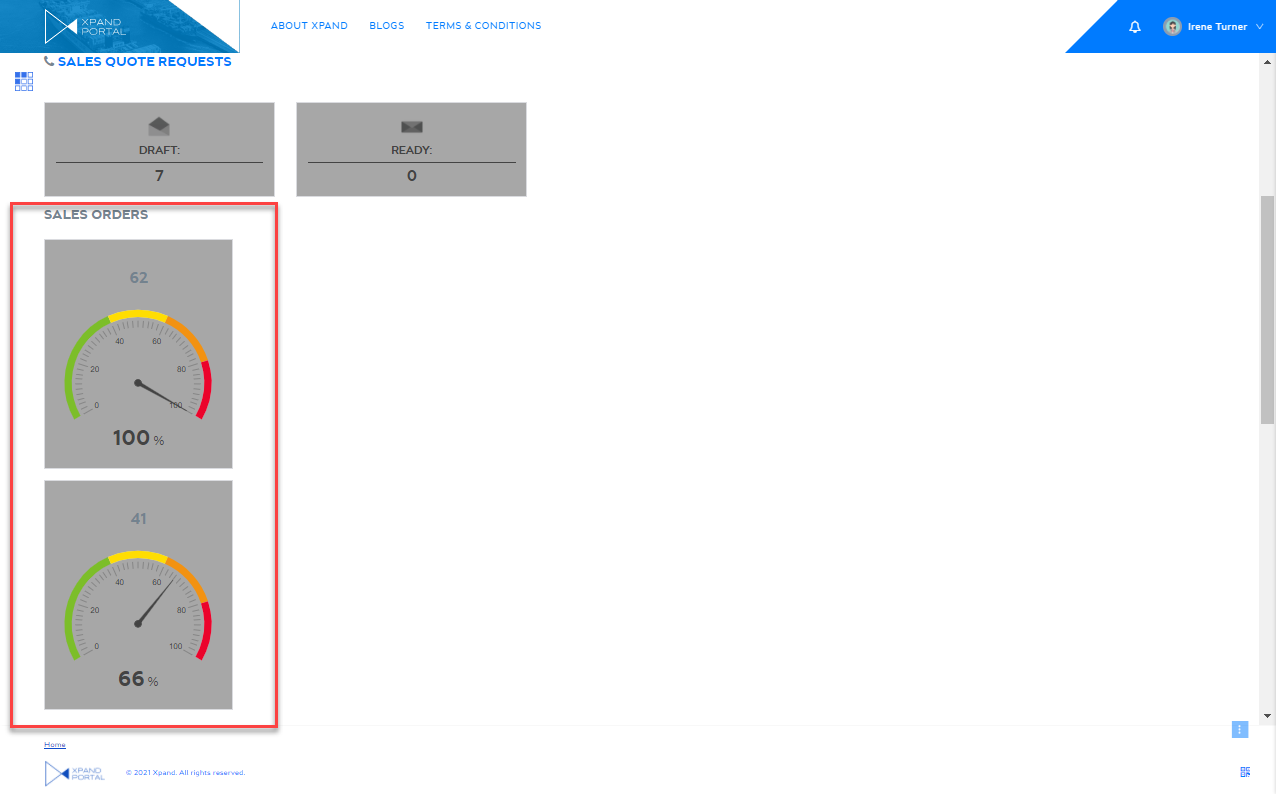
- Select Save and publish to save the changes and publish them on the front end. Optionally, if you were editing the page, you can select Save and preview to preview how the page will look like on the front end.
|
The layout settings of the parent layout block determine how this layout block element will be displayed on the page (on a tab, on top or below of other content elements, etc.). |